
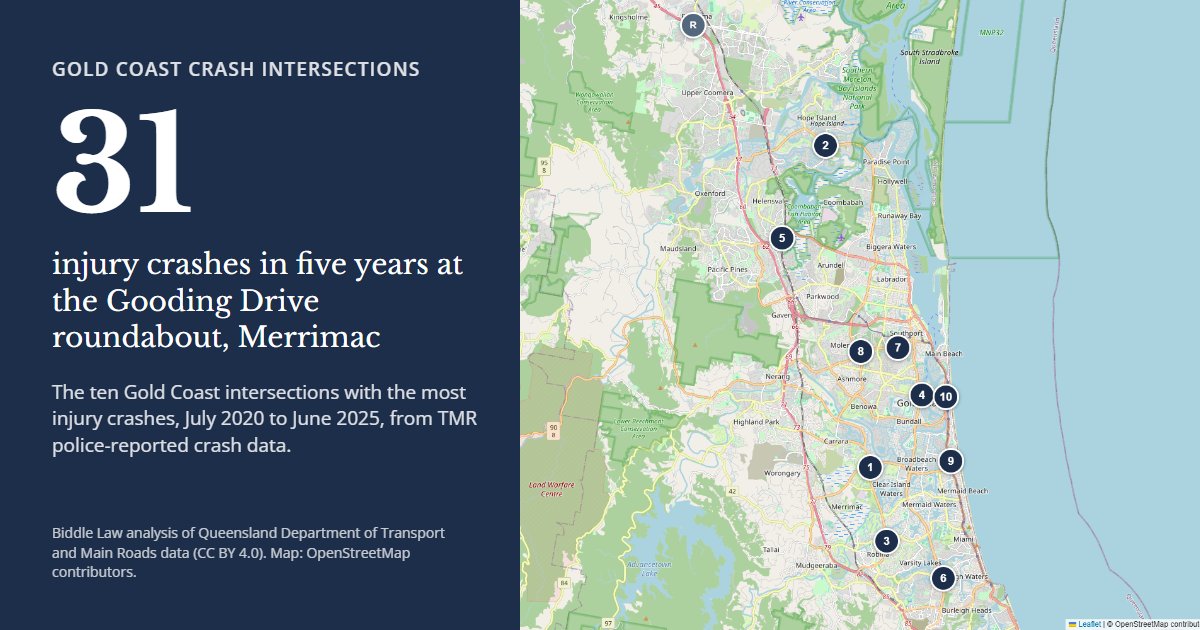
Which Gold Coast intersection has recorded the most injury crashes? The Gooding Drive roundabout at Merrimac, where Nerang-Broadbeach Road and Robina Parkway meet. This major junction connects Merrimac and the inland suburbs with Robina, Carrara, Broadbeach and the M1, with easy access to Pacific Fair, Carrara Markets, the Carrara sporting precinct and the Gold Coast hinterland.
Police have recorded 31 crashes with at least one person hurt there between July 2020 and June 2025, and another 30 in the five years before that, so it’s been averaging around six a year for a decade, with little change in the reported data.
At Biddle Law, a Gold Coast personal injury law firm, we act for people injured in car accidents. As Gold Coast locals, we already knew some of the roads that have a reputation for being more challenging, but we were interested to know where crashes happen.
That’s why we decided to look at the Queensland Government’s crash records for every intersection across the Gold Coast, group them by location, and compare the last five years (July 2020 to June 2025) with the five before (July 2015 to June 2020). Below are the results we found, with the method and the data at the end if you need more information.
What the data tells us
As we mentioned above, the Gooding Drive roundabout at Merrimac recorded 31 injury crashes in five years, the most of any Gold Coast intersection, which is understandable given its size, and another 30 in the five years before that. Thankfully, most were not serious: in 5 of the 31, someone was taken to hospital. It’s still an area with a very notable number of traffic incidents.
Other significant findings
- Serious crashes at Gold Coast intersections, in which someone was taken to hospital or died, rose 21 percent between the two five-year periods we looked at, from 1,122 in July 2015 to June 2020 to 1,359 in July 2020 to June 2025.
- The Gold Coast’s population grew over the same years, from 633,598 in June 2021 to 691,230 in June 2025, about 9 percent, on ABS estimates.
- Population growth explains part of that rise, but not all of it: serious crashes rose more than twice as fast as the population.
- In RACQ’s March 2020 list of Queensland’s worst intersections, built on data to June 2019, two Gold Coast sites were first and third in the state. Neither is in the top ten now: Gold Coast Highway at Clifford Street fell from 11 injury crashes to 2, and serious crashes at Southport-Nerang Road and Currumburra Road fell from 11 to 7.
- Minnie Street and Nerang Street in Southport had 9 serious crashes out of 20, the second-highest of any site, and is on the state government’s August 2026 list of intersections to upgrade.
- The Attenborough Boulevard roundabout at Pimpama recorded 26 injury crashes, then none in the ten months after it was replaced with traffic lights in September 2024.
The ten intersections with the most injury crashes
Every count below is a police-reported crash where at least one person was injured, from July 2020 to June 2025. ‘Serious’ means someone died or was taken to hospital. The last column is the injury crash count for July 2015 to June 2020, so you can see which way each site is heading.
| Rank | Intersection | Injury crashes 2020 to 2025 | Serious | Injury crashes 2015 to 2020 |
|---|---|---|---|---|
| 1 | Gooding Dr, Nerang-Broadbeach Rd and Robina Pkwy roundabout Merrimac | 31 | 5 | 30 |
| 2 | Helensvale Rd and Hope Island Rd roundabout Hope Island | 29 | 6 | 14 |
| 3 | Cheltenham Dr and Robina Pkwy Robina | 26 | 6 | 12 |
| 4 | Bundall Rd, Ferry Rd, Slatyer Ave and Thomas Dr Bundall | 21 | 8 | 12 |
| 5 | Discovery Dr and Gold Coast Hwy Helensvale | 21 | 5 | 19 |
| 6 | Bermuda St and Christine Ave Burleigh Waters | 21 | 4 | 15 |
| 7 | Minnie St and Nerang St Southport | 20 | 9 | 11 |
| 8 | Olsen Ave, Southport-Nerang Rd and Currumburra Rd Ashmore | 20 | 7 | 15 |
| 9 | Gold Coast Hwy and T.E. Peters Dr Broadbeach | 19 | 6 | 10 |
| 10 | Elkhorn Ave and Ferny Ave Surfers Paradise | 18 | 7 | 12 |
The map below shows all ten. Attenborough Boulevard and Yawalpah Road at Pimpama recorded 26 injury crashes in the same period but is not ranked, because the roundabout they happened at has since been replaced. It has its own section further down.
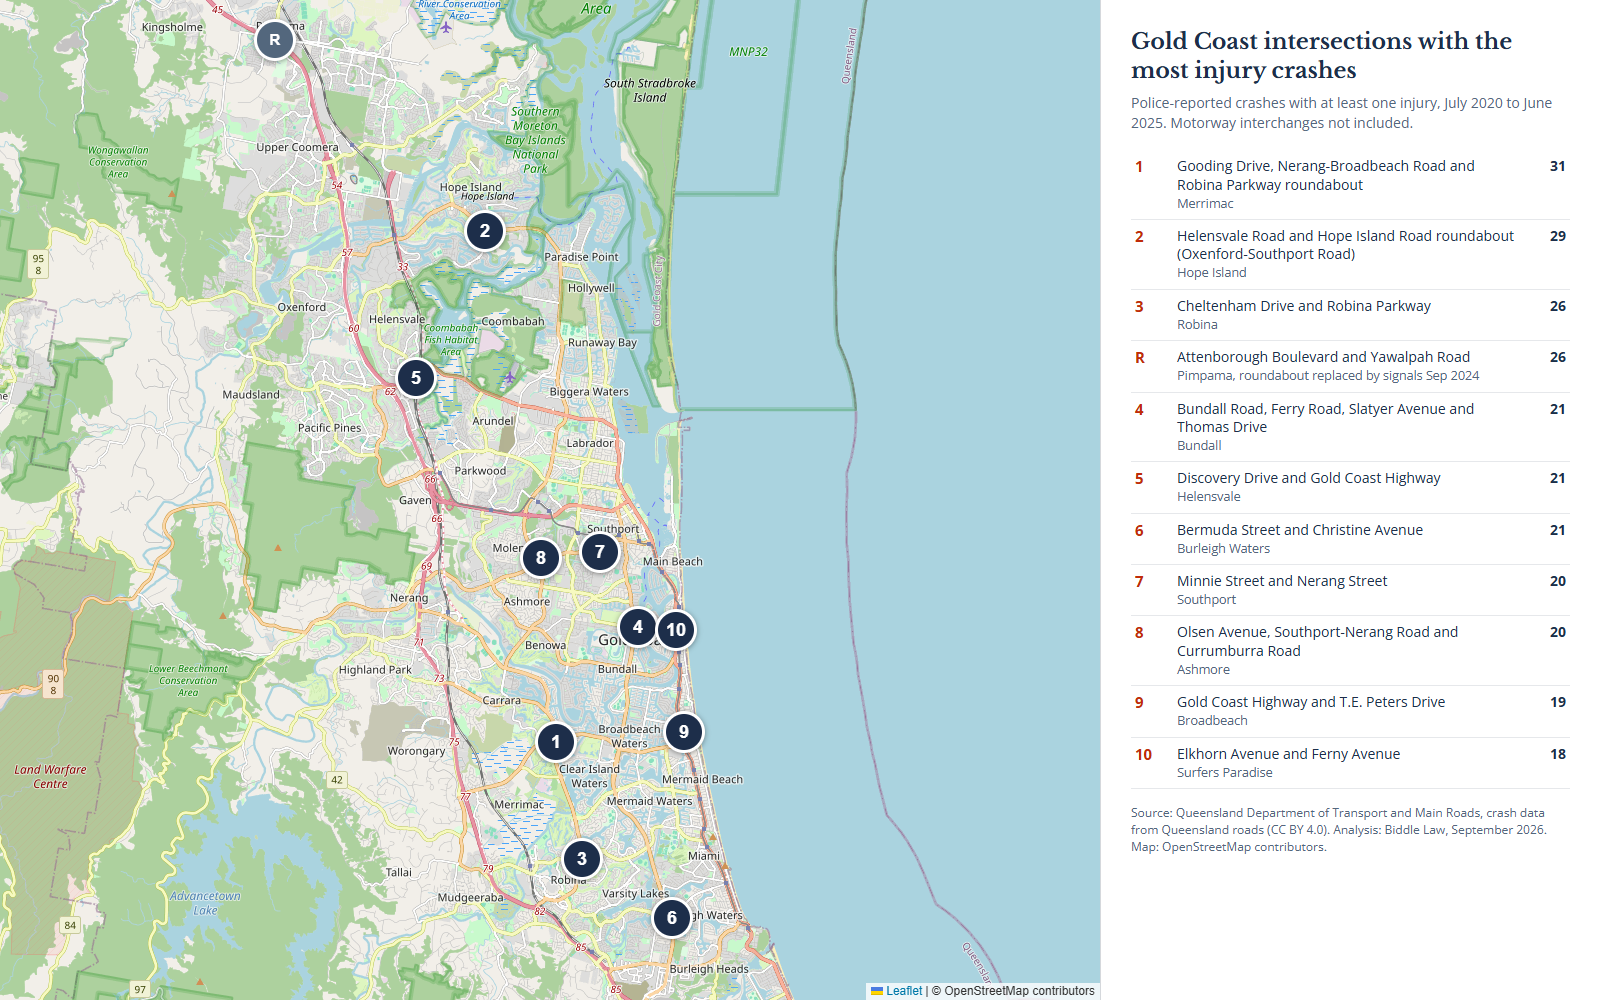
Map: OpenStreetMap contributors. Analysis: Biddle Law.
The Merrimac roundabout is the steadiest site on the list, and the one improvement there is in severity: serious crashes fell from 9 to 5. Rear-end crashes made up half of its total. Transport and Main Roads rebuilt it in early 2018 as the Gold Coast’s first three-lane partially signalised roundabout, and the count hasn’t moved: six injury crashes a year in the five years before the work, just under seven a year since.
The Hope Island roundabout is the opposite story. Injury crashes there more than doubled, from 14 to 29, as Hope Island Road (recorded by TMR as Oxenford-Southport Road), Helensvale Road, Sickle Avenue and Broadwater Avenue all feed into one circle. Six of the 29 were serious, one of them fatal. Rear-end crashes were the most common type, 15 of the 29.
Cheltenham Drive at Robina Parkway, a T-junction with traffic lights, also more than doubled, from 12 to 26. The two biggest rises on the list, Hope Island and Robina, both came at sites that were outside the top ten five years ago.
What’s changed since RACQ’s 2019 data
In March 2020, RACQ published a list of the Queensland intersections with the most serious crashes over the three years to June 2019. Two Gold Coast sites were at the top of it: Gold Coast Highway at Clifford Street in Surfers Paradise, first in the state, and Southport-Nerang Road at Currumburra Road, third. Neither is in the top ten now. RACQ’s next list, published in February 2022 on crashes to May 2021, had no Gold Coast intersection in it at all.
Clifford Street is the clearest change. It recorded 11 injury crashes between July 2015 and June 2020, seven of them serious, then 2 in the five years since. The site peaked in 2016 and 2017, with seven and eight injury crashes, and hasn’t recorded more than four in any year since 2018. No treatment at that corner is on the public record, and the numbers alone don’t show a cause.
The Currumburra Road junction, which police also record under Olsen Avenue, went the wrong way on one measure and the right way on another. Injury crashes rose from 15 to 20, but serious crashes fell from 11 to 7.
Across the whole city, intersection injury crashes rose 7 percent between the two periods, from 3,297 to 3,517, and serious crashes rose faster. So crashes haven’t simply moved north. There are more of them, and more of the bad ones, than five years ago.
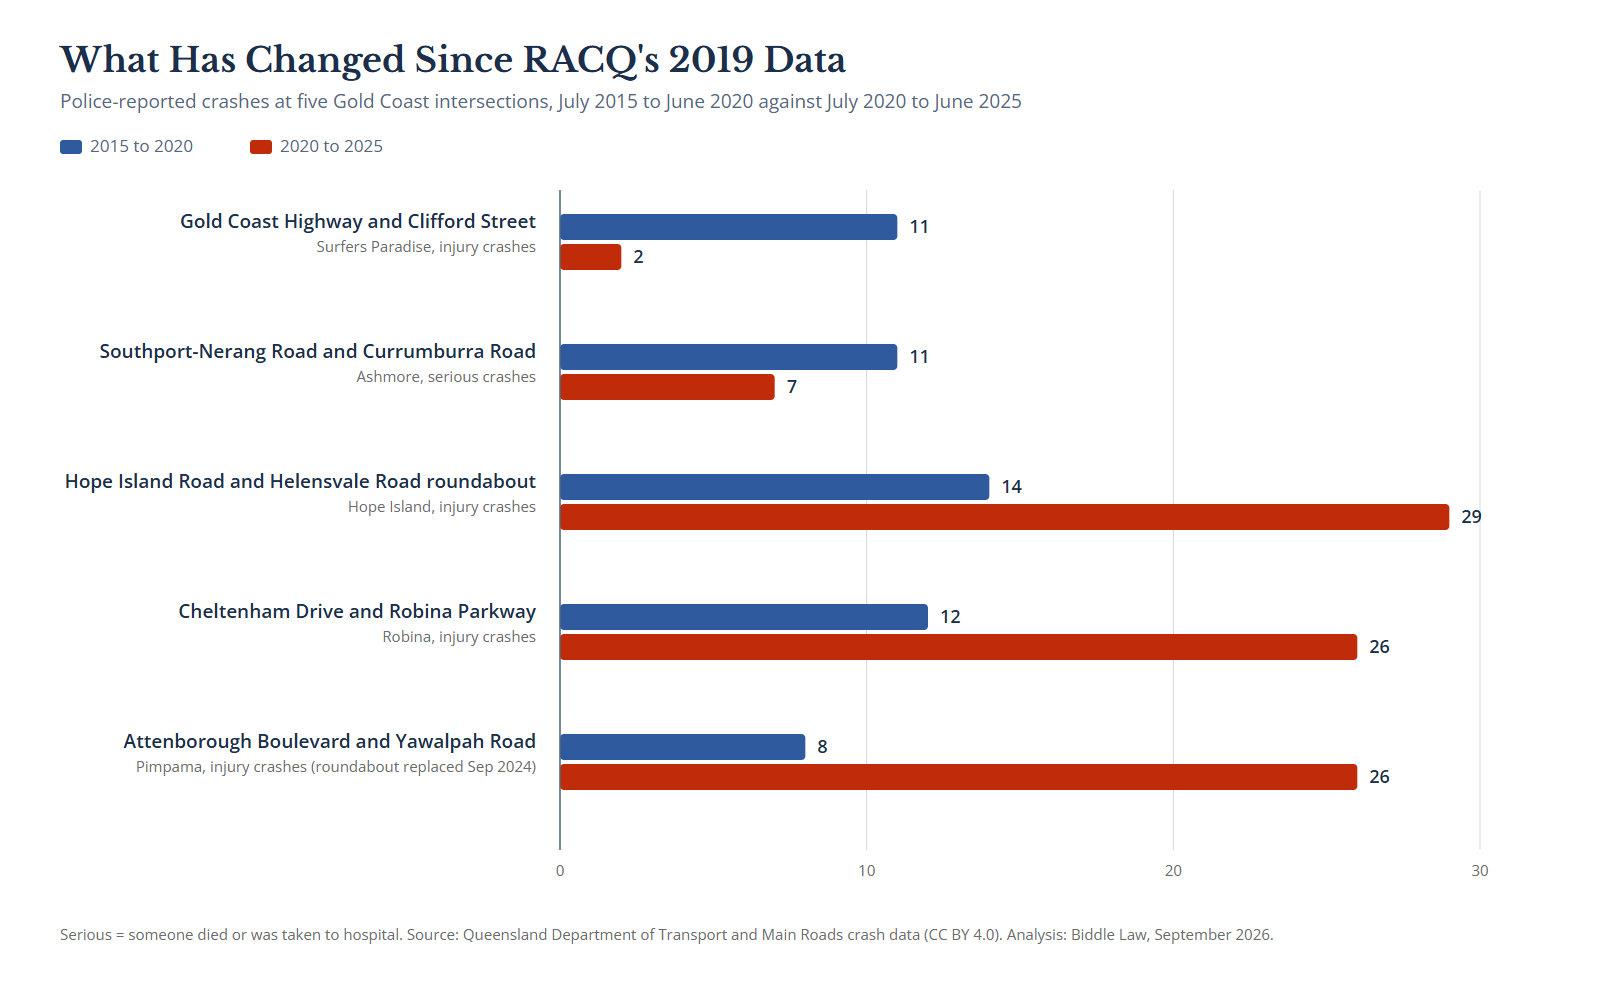
Source: TMR crash data (CC BY 4.0). Analysis: Biddle Law.
Pimpama: the roundabout replaced with traffic lights
The Attenborough Boulevard and Yawalpah Road roundabout at Pimpama recorded between seven and ten injury crashes every year from 2021 to 2024. That put it level with the top three on this list.
Transport and Main Roads rebuilt the M1 Exit 49 interchange between August 2022 and February 2025, removing the roundabouts on both sides of the motorway and replacing them with traffic lights. The eastern side, where Attenborough Boulevard and Yawalpah Road meet, switched over during a weekend closure from 6 to 9 September 2024.
The last injury crash recorded at the old roundabout was in July 2024. In the ten months from the September switch to June 2025, the end of the data, there were none. Ten months isn’t long enough to call it fixed, and the count needs another year or two before anyone should. It is, though, the clearest before-and-after on the Gold Coast right now, and it’s why Pimpama isn’t ranked above.
Where upgrades are planned: Minnie Street and Black Spot funding
On 14 August 2026 the Premier and the Transport Minister released the Gold Coast Transport Plan. The statement says the plan ‘will also see upgrades at key intersections including Southport-Nerang Road at Minnie Street’. That’s the Southport junction that sits seventh on this list by crash count and second by serious crashes: in 9 of its 20 crashes someone died or went to hospital. Only Ferny Avenue at Ocean Avenue in Surfers Paradise had more, with 10 of its 17. Fourteen of the 20 Minnie Street crashes involved vehicles turning across oncoming traffic. No date or budget has been published for the work yet.
None of the ten ranked sites has received federal Black Spot funding in the last decade. That sounds worse than it is. The Black Spot Program pays for measures such as traffic signals and roundabouts, and the Gold Coast projects it has funded since 2016 have been smaller local junctions in suburbs like Runaway Bay, Palm Beach, Labrador and Nerang. Upgrades on the scale of the Minnie Street work are normally funded outside the program.
Where the program has been used, it can work. Scottsdale Drive at Stapley Drive in Varsity Lakes was funded in 2021-22 after 14 injury crashes in the previous five years. It recorded one in 2023 and 2024 combined. A small sample from one site, but the direction you’d want. Anyone can nominate a site for Black Spot funding, including residents and community groups, through the program’s website.
If you were hurt at one of these intersections
If you were injured in a crash at one of these intersections, or anywhere else on the Gold Coast, three things come first. Get medical treatment. Report the crash to police. Keep photos, the other driver’s details, witness names and any letter an insurer sends you. Those records matter later, whatever you decide to do.
Biddle Law is a personal injury and estates practice in Nerang. Howard Biddle acts for people injured in car accidents across the Gold Coast, on a no win, no fee basis. (07) 5651 5111, or through our contact page.
How this list was built
The data is the Queensland Department of Transport and Main Roads’ road crash locations dataset, published on the Queensland Government open data portal under a Creative Commons Attribution 4.0 licence. The version we used was updated in April 2026 and covers crashes to 30 June 2025. Every record is a crash reported to Queensland Police, with its coordinates, severity and the streets involved.
We kept crashes that met all of these tests:
- Inside the Gold Coast City local government area.
- At least one person injured. TMR grades these as fatal, hospitalisation, medical treatment or minor injury. Property-damage-only crashes were left out because TMR stopped publishing them after 2010.
- Recorded by police at an intersection: a roundabout, a T-junction, a crossroads or a multi-leg junction.
- Not at a motorway interchange. The M1 ramps are a system rather than one junction, so they were set aside.
Police often record the same roundabout under different pairs of street names, so we grouped crashes by location, treating anything within 75 metres of a site as the same intersection. The three sites merged that way (Merrimac, Bundall and Hope Island) were checked on a map to confirm each is one physical junction. That’s also why some names above are longer than a road sign.
We counted two five-year periods, July 2015 to June 2020 and July 2020 to June 2025, and ranked on injury crashes in the recent one, with serious crashes as the tie-break. An independent second pass matched every count recorded under the same street names; the location grouping then added the crashes police had recorded under other names for the same junction. Below tenth place, sites sit within a crash or two of each other, so we haven’t quoted ranks past ten.
This list measures counts, not risk. TMR doesn’t publish traffic volumes alongside the crash data, so a busy arterial junction will record more crashes than a quiet one even if both are equally safe per trip. That’s why we rank by the number of injury crashes and make no claim about which intersection is the riskiest to drive through.
Use this data
The table, the map and the chart are free to reuse under the same Creative Commons Attribution 4.0 licence as the source. Credit it as ‘Biddle Law analysis of Queensland Department of Transport and Main Roads crash data’. Download the map or the chart as full-size PNG files. We will update this page when TMR publishes the next full financial year of crash records.
Media enquiries
Journalists can reach Howard Biddle on (07) 5651 5111 or through our contact page. He is available for an interview on what the data shows.
